Perspective (noun):
capacity to view things in their true relations or relative importance
PE Perspective® gives the GP private equity professional the capacity to view portco performance through the lenses of cash flow reconciliation, pro forma perspective, and disciplines such as fixed cost control.
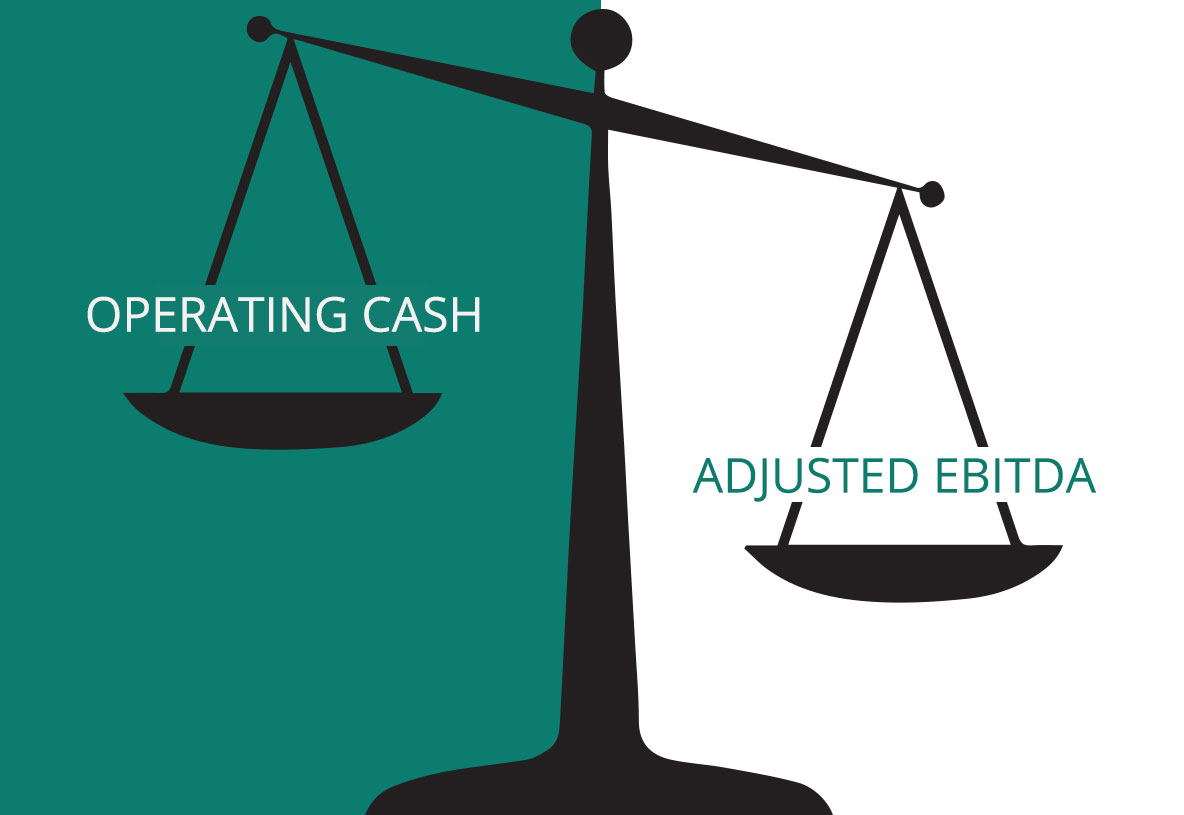
Our software provides perspective into portfolio trends that are grounded in cash and the true run rate of the business.
PE Perspective® (“PEP”) is NOT a watered down reporting tool for the entire alternative asset class, nor does it provide back office support for fund administration.
PEP enables PE professionals to see performance in the proper context, EBITDA in relation to cash, current period in relation to pro forma prior period, current inventory or margin levels in relation to values at Closing.
PE portfolio monitoring needs to be timely, one portal, one drop-down, even one page
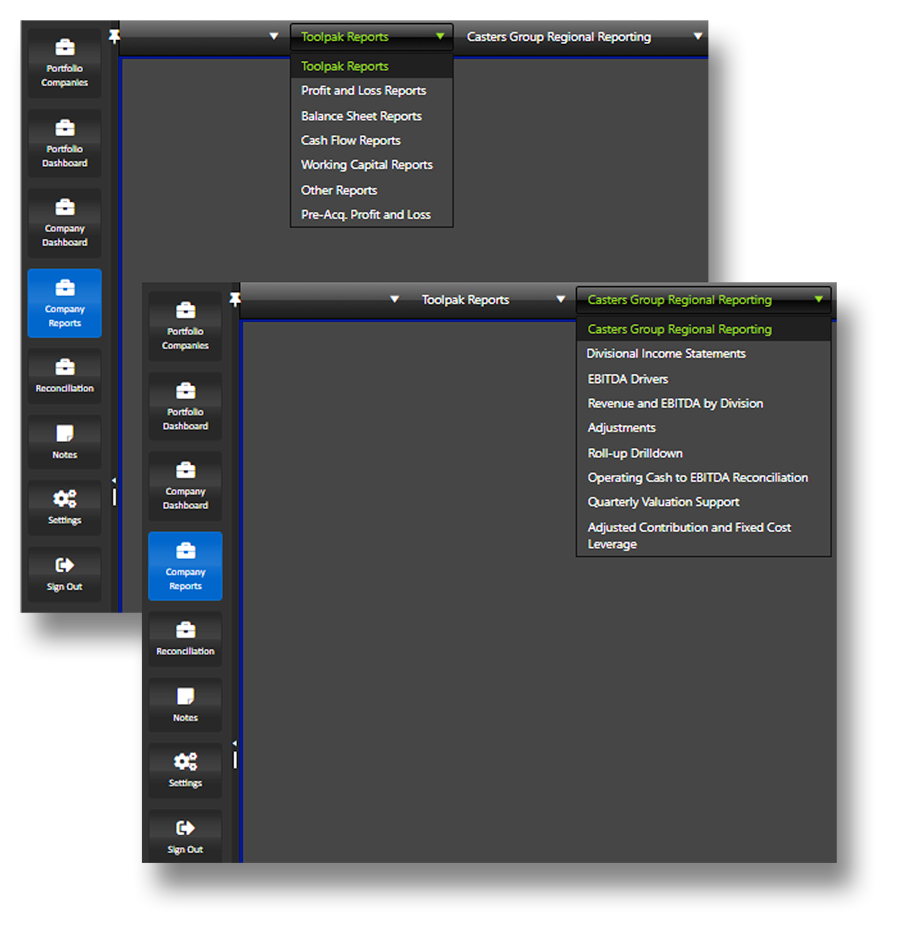
Toolpak: One drop-down, One place to go
We asked questions and listened:
How can we deliver meaningful metrics that are comparable between periods and therefore insightful?
What gauges do you need to see monthly to be smart and current on your companies?
What metrics do you need immediately in a crisis or when things don’t go as planned?
How can we offer historical perspective vs. Closing so that you can consistently gauge progress?
How can our Firm and our software leverage your capacity and not just overwhelm with data?
How can we help you improve internal transparency and eliminate Excel silo culture?
We got a consistent answer:
“Please don’t just produce another pile of reports, just give me insight, give me regular monthly perspective that I can’t get out of a financial package.”
If you can’t actually measure it, or even worse, if you can’t even collectively see it as a team or as a Firm, you can’t manage it.
Momentum
Real Life Client Conversations:
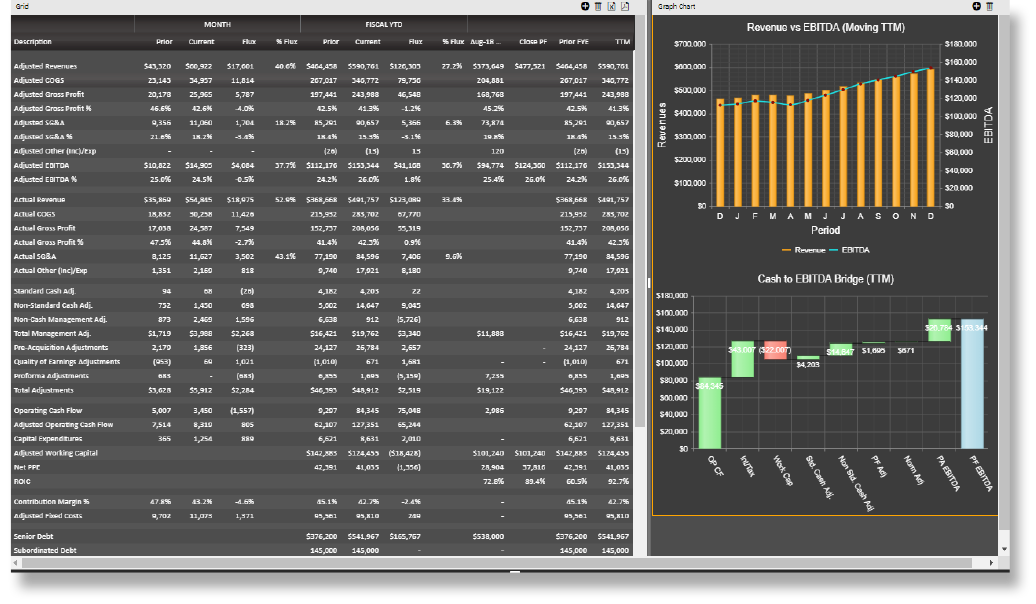
I need to be able to actually see the momentum in my companies. YTD vs YTD is good, but how have they been trending TTM? Can you graph that so I can see it each month?
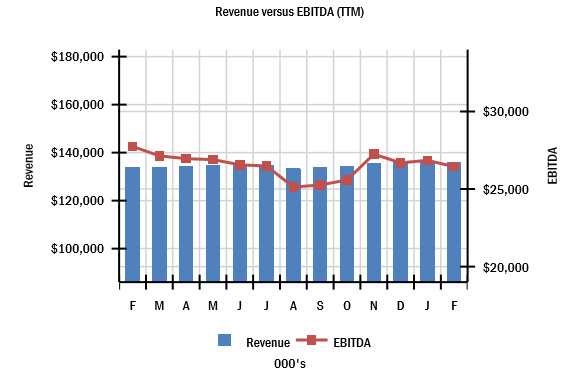
- TTM Revenues vs TTM EBITDA is the ultimate graph of momentum. This graph accompanies the monthly dashboard and is available every month automatically.
- Just as importantly, this graph is available for everyone else in the firm to see which improves transparency.
Cash is King
Real Life Client Conversations:
I want to see at a glance if EBITDA hangs with cash flow. I don’t want to dig for it or do the math. The cash to EBITDA gap seems to be growing and business is flat so something’s not right. Can you graph that reconciliation to see the bridge and the gap?
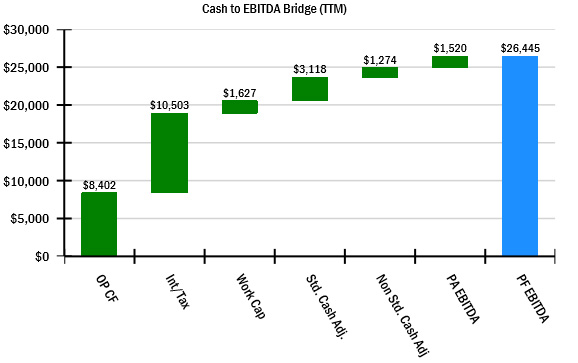
- The Operating Cash Flow to EBITDA Rec is available every month automatically as part of the monthly dashboard.
- The questions that come out of that review include does the working capital change make sense relative to revenue volume changes?
- Just as importantly, this graph is available for everyone else in the firm to see which improves transparency.
Addback Visibility
Real Life Client Conversations:
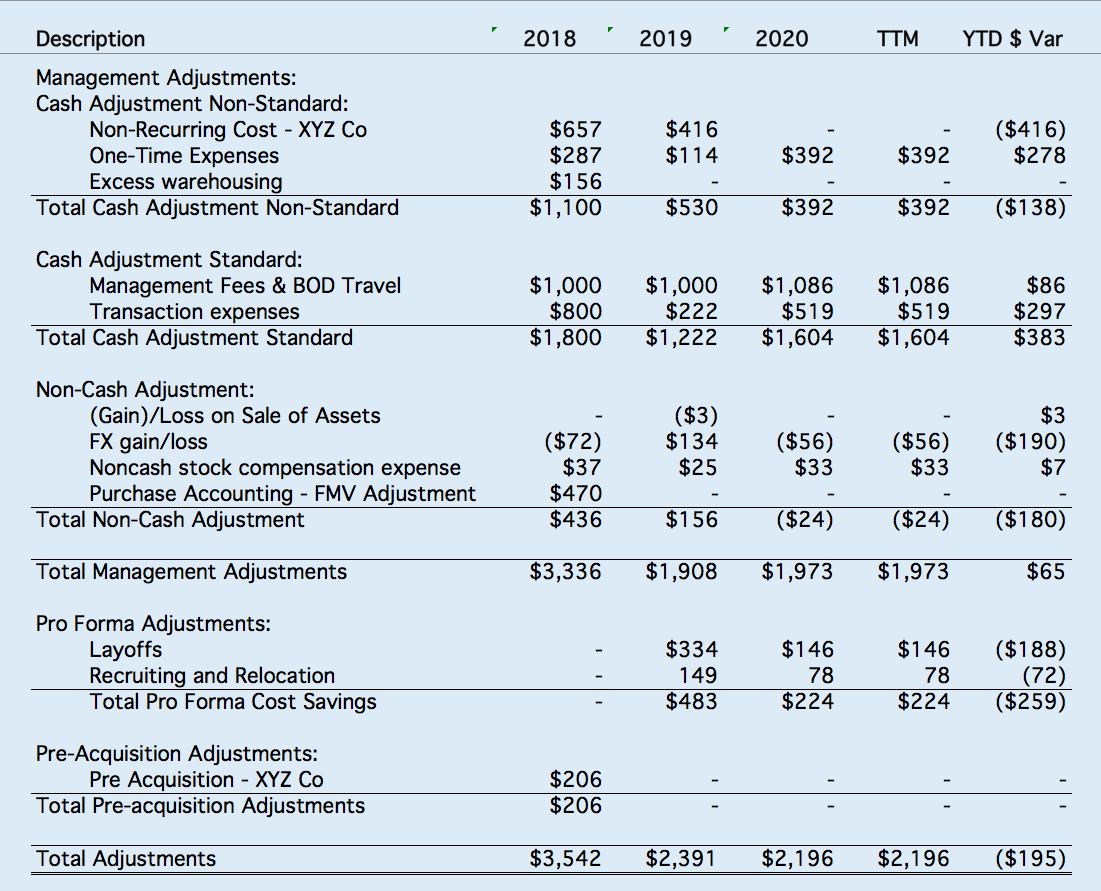
I am not sure what non-recurring is any more. We have had $5 million in addbacks for three years now. I need to see which are tailing off, new addbacks, cash, non-cash, etc.
- In the Cash to EBITDA Bridge, an important consideration is the cash burden of cash addbacks on operating cash flow.
- Cash adjustments are segregated into Standard (management fees, diligence cost, etc.) and Non-standard (restructuring, severance, etc). This perspective facilitates focus on Non-standard to quickly address legitimacy.
- Non-cash Adjustments are important to segregate from balance sheet changes to present the proper cash flow impact.
- Pre-acquisition adjustments include the financial results of an entity before it was acquired.
Historical Perspective
Real Life Client Conversations:
I need to see Momentum, Rec to Cash and I need to easily reference Closing metrics, a column in our dashboard to give perspective. Margin up since Closing? Down? All of this in one place, one report.
Having @Closing column is helpful, but can I have Close PF to reflect all acquisitions for this platform? TTM vs Closing means nothing without acquisition EBITDA.
Pro Forma Perspective
Real Life Client Conversations:
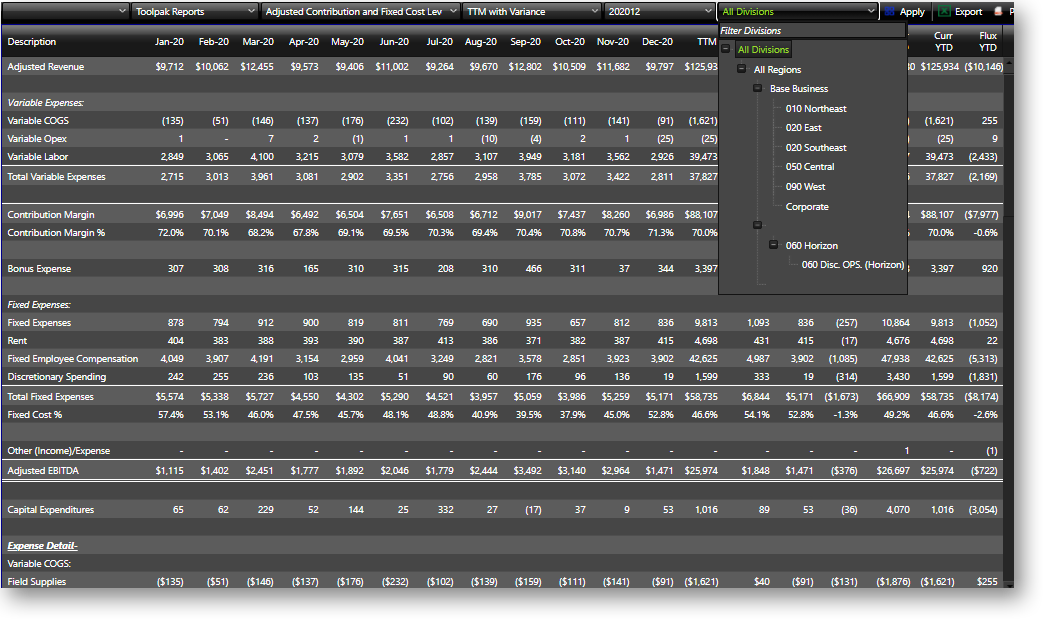
I need to layer in pre-acq pro formas so I can compare to last year. I need to always keep track of Continuing or Base Business to track fixed cost trends and savings. Can I just toggle off acquisitions to see “Base” trends? Can I layer in fixed cost detail pre-acquisition so I have comparable cost detail to see emerging synergies?
Reconciliation
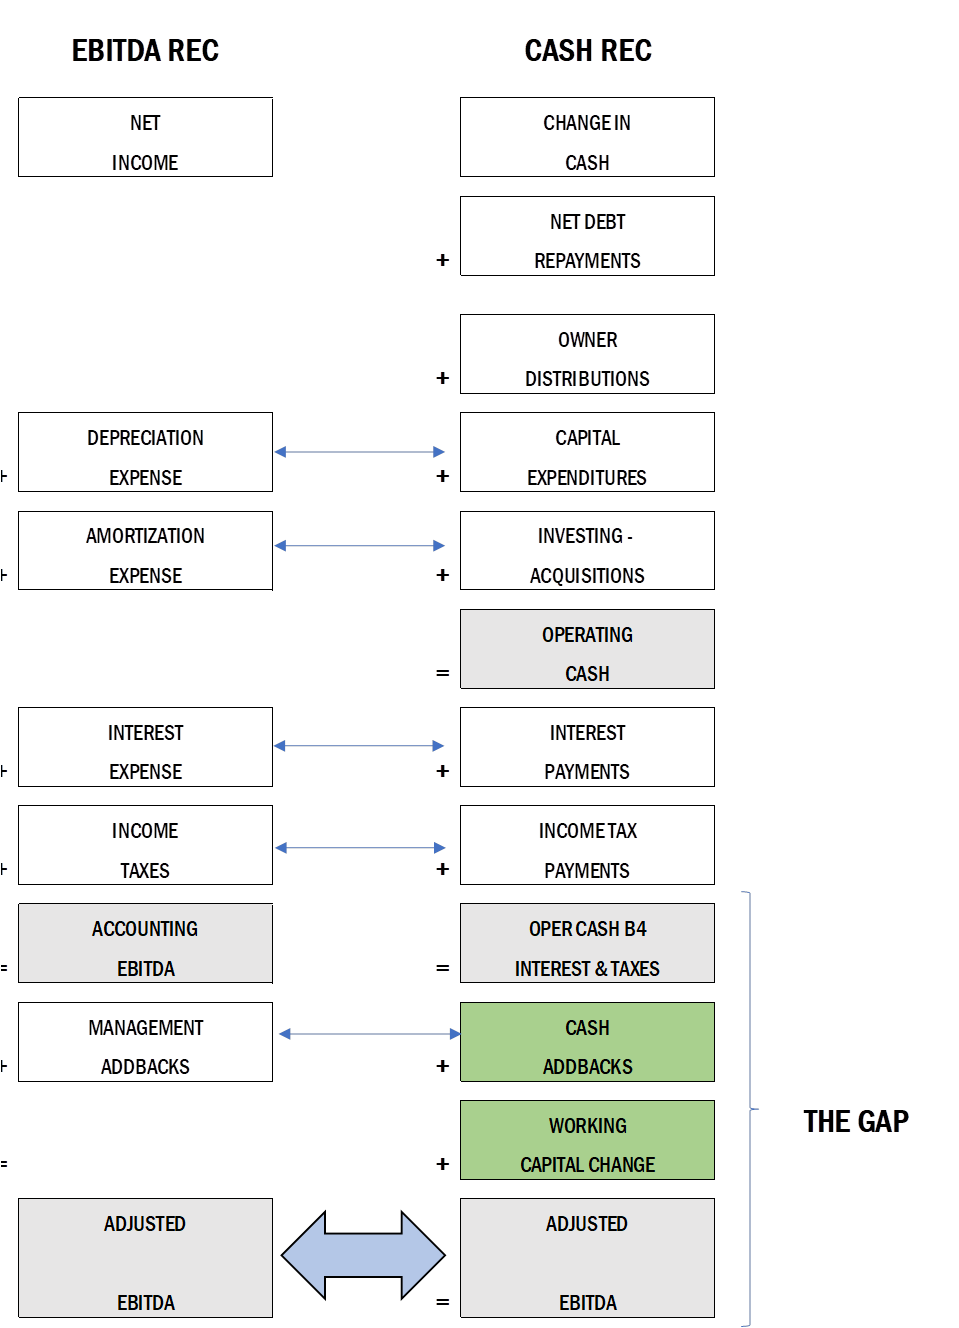
The traditional EBITDA reconciliation is the foundation for valuation. The PEP Cash Reconciliation takes the change in cash per the cash flow statement and reconciles down to that same Adjusted EBITDA.
Trial balance data drives the change in operating cash flows before interest and taxes and the Cash to EBITDA Gap is quantified. This Gap is made up of Cash Addbacks plus the change in working capital. With the ability to see trial balance fluctuations, it is easy to see the drivers of working capital change. The next step is to make sense of the change in relation to growth trends.
That Gap is monitored monthly throughout the portco holding period to ensure that EBITDA growth is translating into cash flow growth. A widening gap merits investigation or at least understanding in order to feel comfortable with valuation and financial accuracy.
All is good if cash consistently hangs with EBITDA.
PE Perspective® is a registered trademark of Empire Value Advisors, LLC (“EVA”). We are private equity consultants, accountants at the core, who facilitate historical perspective, collaboration and buy-in throughout the deal spectrum. This perspective enables clients to finish first at auction, manage through portfolio challenges, and exit investments efficiently. PEP is the foundation for our philosophy and our service model.